Welcome back to our series on a player’s journey into and through Idle Miner Tycoon. Last time we talked about how players find us organically. Across the mobile game industry, that’s a little over half of all players. But we can’t forget the other half! We get a lot of players into the game through paid advertising and there’s a lot there to talk about.
UA Installs
We run ads in a lot of different places in order to bring in new players. On any given month we might have several hundred ads running across ad networks like Google, Unity or Vungle. Hundreds is a lot, but that takes into account static banner ads, playable video ads, the same ad running in multiple languages and dozens of other variations customized for the market, OS, or medium. It’s a complicated mix of ads and when they work we pay the platform or network for each new user.
How much do we pay?
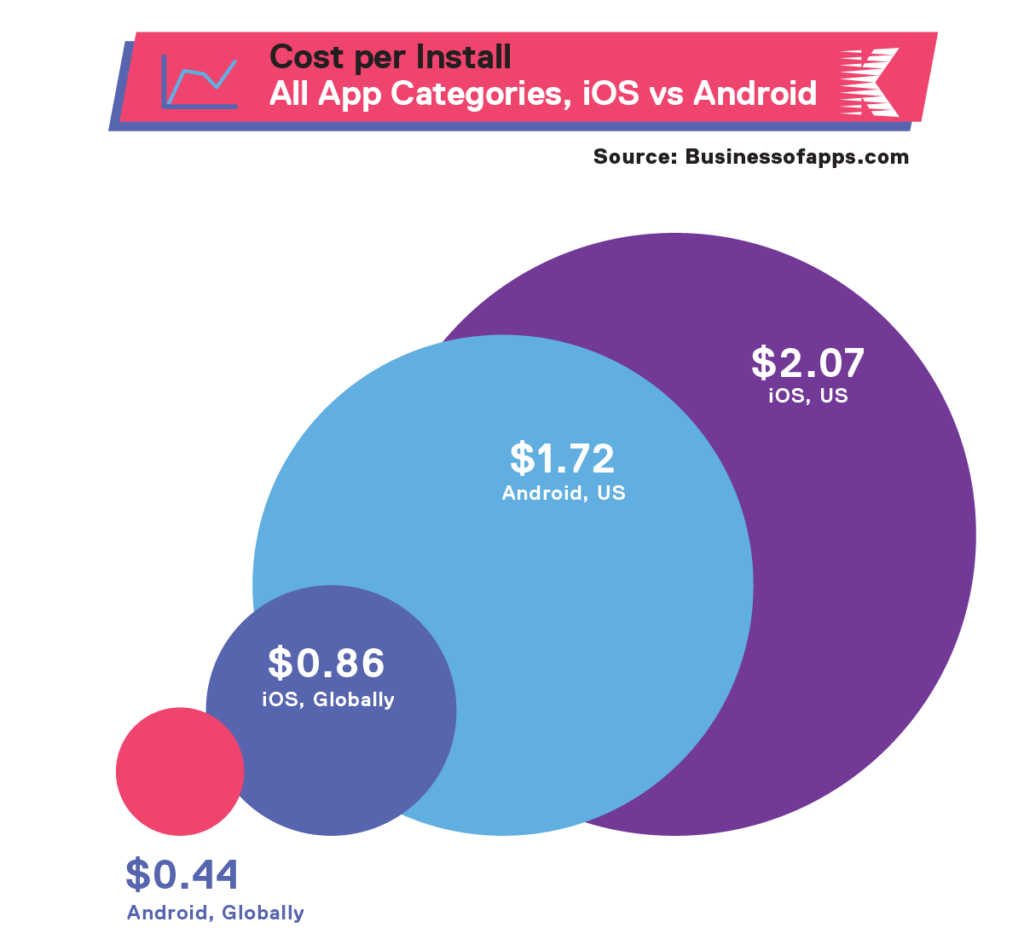
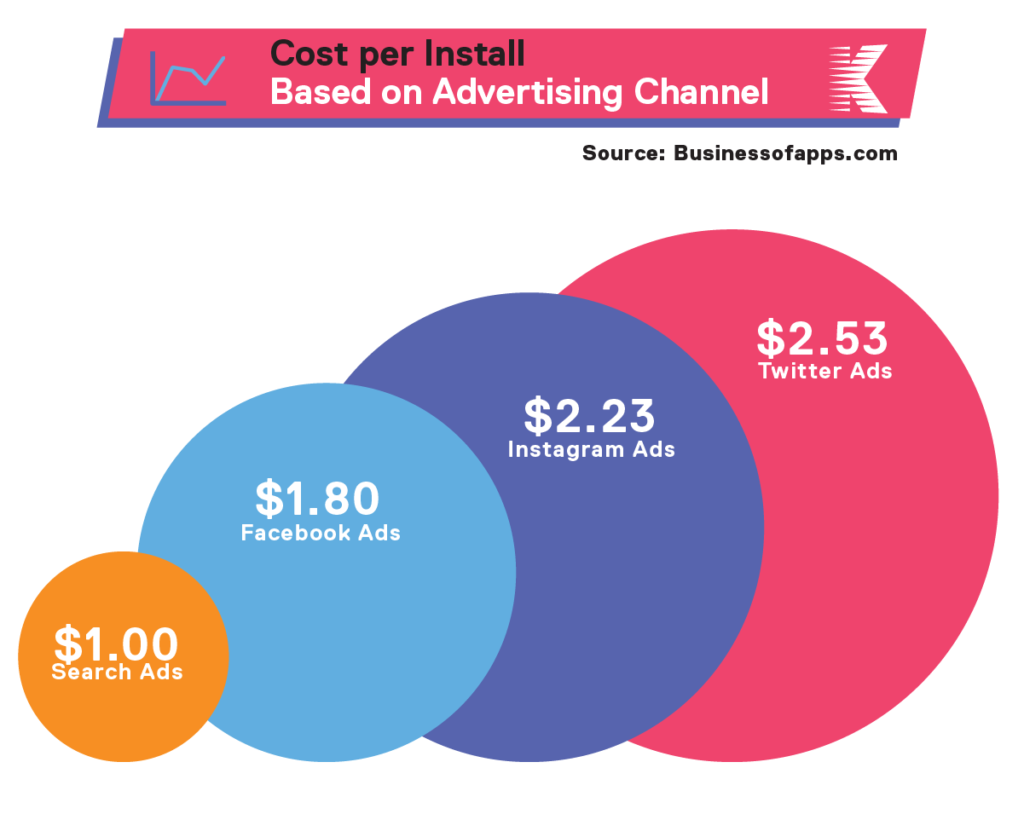
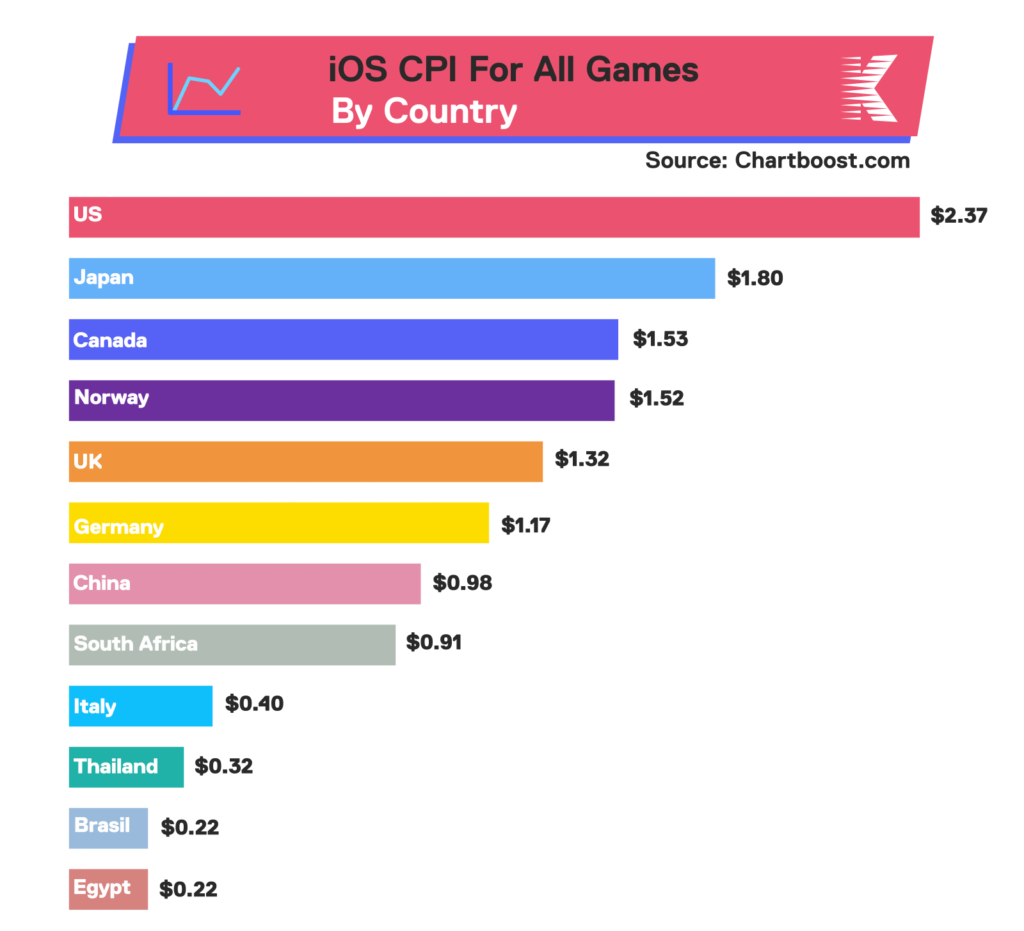
That’s a surprisingly complicated question. Here’s a short list of things that can affect CPI (Cost Per Install):
- Platform – iOS vs Android
- Hardware specification – the newest of the new phones vs a four-year-old phone
- Country
- Ad platform – Facebook ad vs. Google Play market
- App genre – Idler vs Hyper-Casual vs Hardcore
- Time of year – summer holidays vs mid-winter
One reaction to all of these widely-varying rates would be to simply pick the cheapest CPI channel and devote our entire marketing budget there. But it’s actually much more complicated and involves considering a player’s Lifetime Value, LTV, and the use of cohort analysis.
LTV, at its simplest, is how much revenue any player generates. In a F2P game like ours that’s free to install and play, revenue comes from In-App Purchases (IAPs) and watching ads. It’s entirely possible to play our game every day for a year and never spend any money or watch a single ad! We’re thrilled to be able to create and share that kind of gameplay – but we also need to pay our developers. So while we want everyone to play our game, we also need to find the players who will buy boosts and Season Passes and watch ads to unlock mines faster.
LTV is essentially a lagging indicator. You never really know how much a player spends in a F2P game until they’ve stopped playing. We have to learn how to predict LTV and the absolute simplest model for LTV is: Retention x Average Daily Revenue (how much the player spends per day, including ad viewing).
Note: it is, again, much more complicated than this, but it’ll do for the purposes of this article.
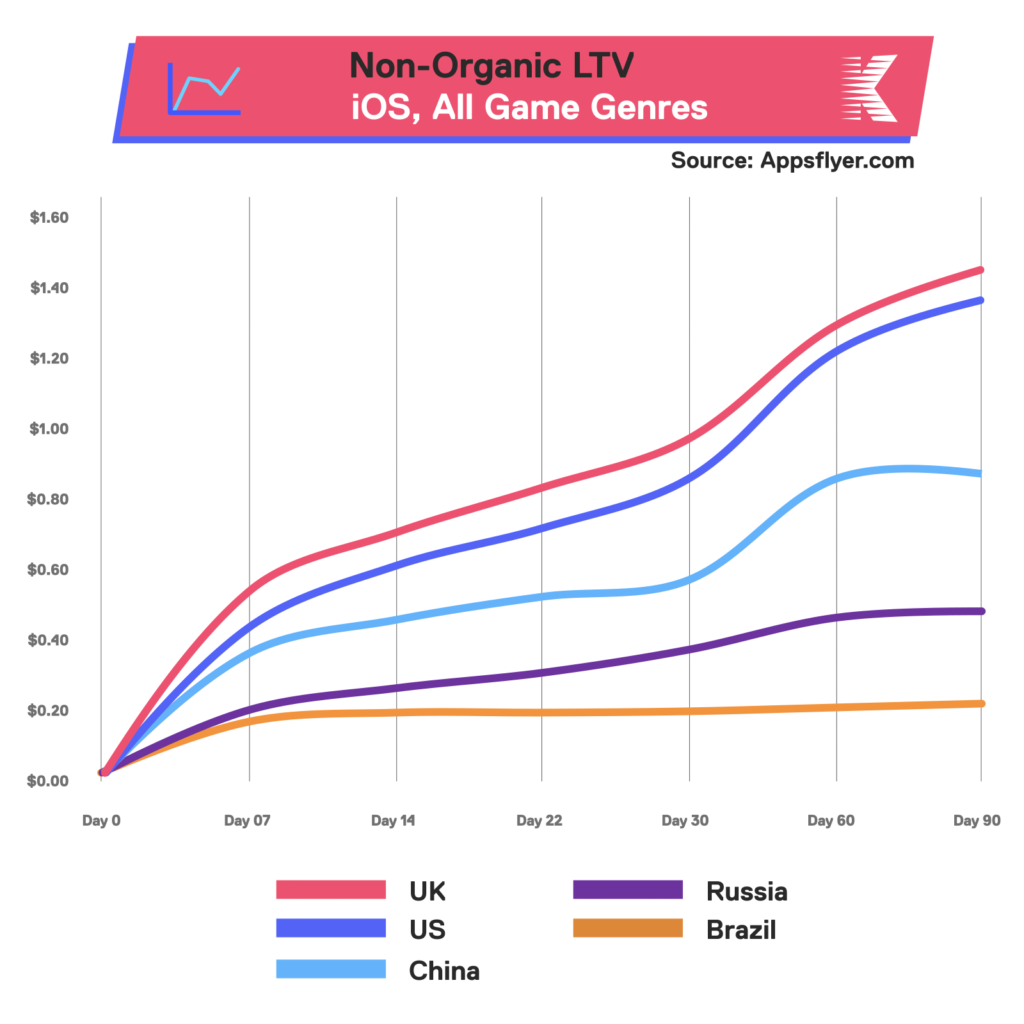
In most cases, LTV rises over time, which makes sense. A player who is still engaged after 7, 14, 28 or 90 days is getting more value out of the game than the player who stopped after two. As such, they’re more willing to watch ads or pay for boosts and cosmetic upgrades to make the game even more enjoyable.
Predicting user behavior for a game as large as ours is, on one hand, tricky because we have such a wide range of players from hyper-casual to end gamers, but on the other hand, we’re lucky to have such a huge set of players to analyze. Generally speaking, the more data you have, the more accurately it can be used. Put another way, 100 million players can’t be wrong!
Here’s where we turn to cohorts.
We saw some examples of cohorts in the previous blog post when we talked about Multivariate Testing. For example, all people who installed our game after finding it in the App Store, with the title IMT: Digging Simulator. That’s a cohort that, in that example, had a higher LTV than the cohorts which found the game through the other two names we tested.
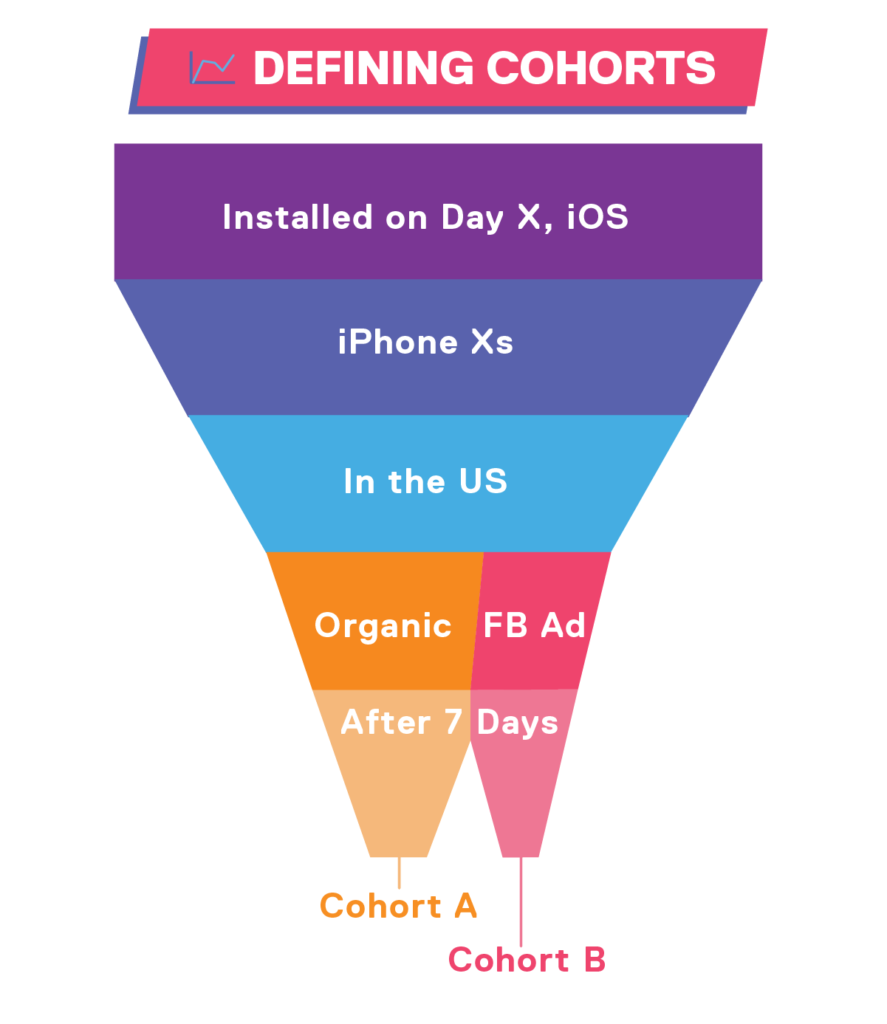
Another common way to define a cohort is to start with everyone who installed the game on a certain day – and then go deeper.
Everyone who installed the game on a certain day on iOS.
….on an iPhone 9.
….in the US.
….who got to the store download page through an ad placed in another game, or organically.
….who is still playing the game 1 day later, 7 days later, 30 days later.
The variations aren’t endless, but there are a lot. The useful part here is that each of these cohorts has, most likely, a different LTV.
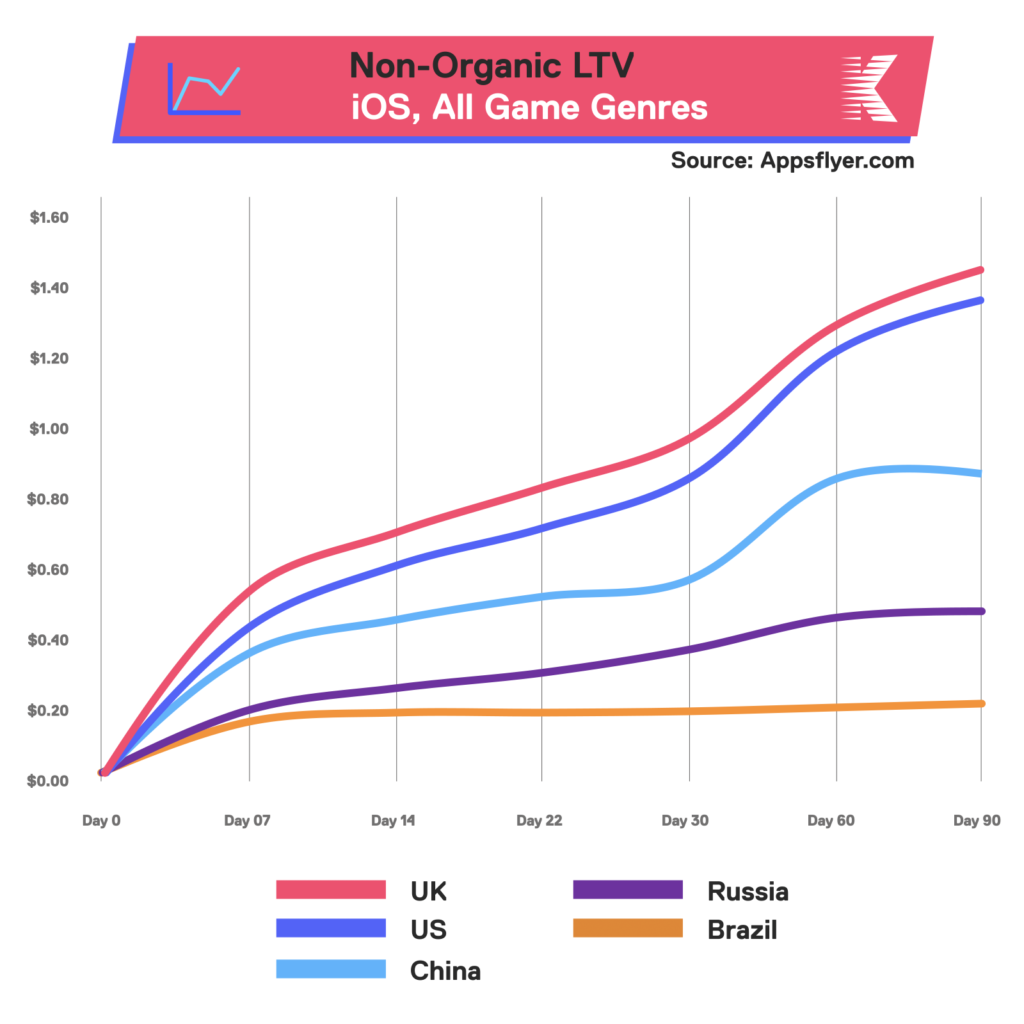
- Looking worldwide, across all game genres, iOS users have a higher LTV than Android users.
- Players on newer, more expensive phones have a higher LTV than players on older phones. Players in the US have, on average, a higher LTV than players in developing countries.
- Players who come from Facebook ads have a higher LTV than players who install the game organically.
Here is where we can decide whether an ad network’s asking CPI is worth it to us. We can compare our three-plus years of data, from over 100 million players and see that historically, Cohort X’s LTV is $0.55. If one vendor is asking $0.56 per install, then we’ll look elsewhere.
Cohort analysis is about to get a lot more complicated with the release of iOS 14.
https://www.adjust.com/blog/mobile-measurement-in-ios-14-four-possible-scenarios/
We’re excited to see how we can adapt to the new landscape and part of our adaption is a renewed focus on our ad creatives.
A/B Testing UA Creatives
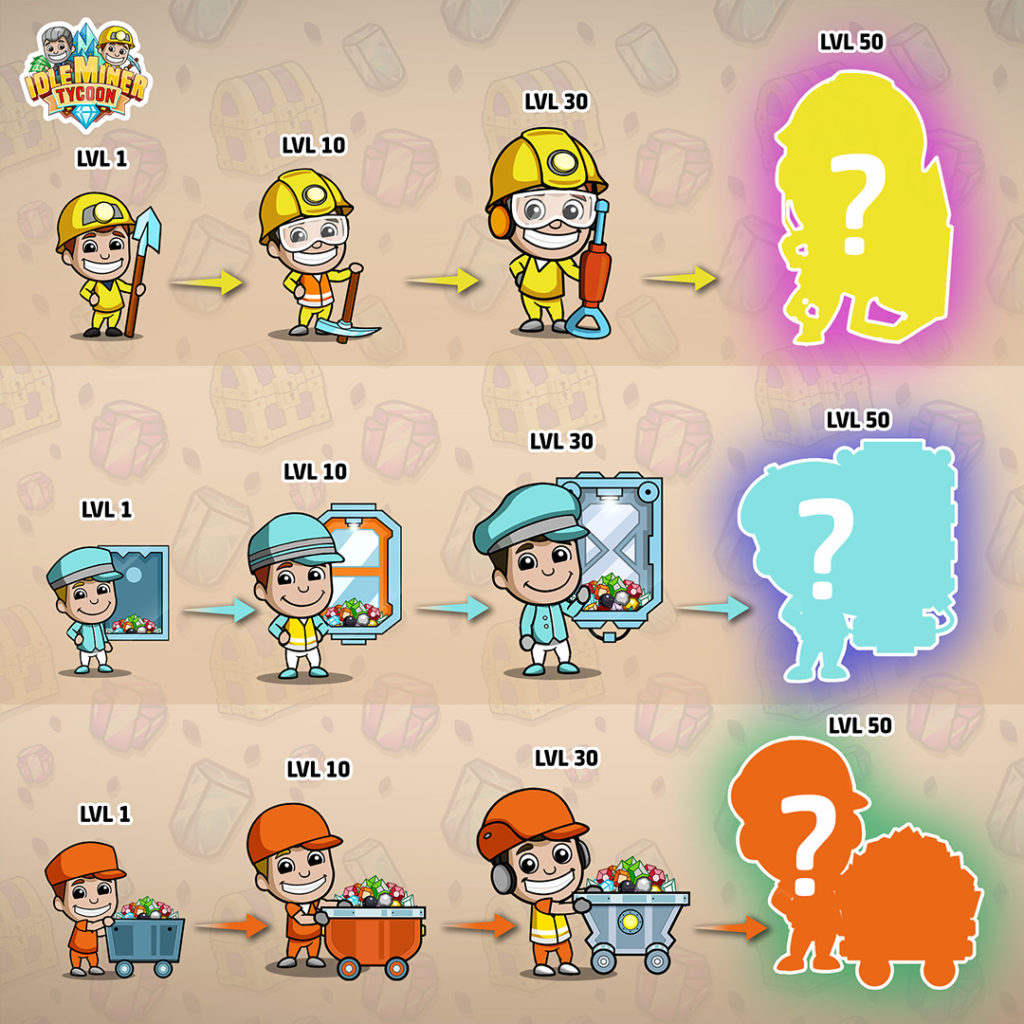
We run a huge variety of ads, including these static and video ads that appear on ad networks from Instagram to TikTok.
Thanks to our ad networks, we have data on which ads do well for different cohorts. We can also break down how different parts of ads perform, though A/B testing.
We are constantly A/B testing our ads. We’ll start with a hypothesis to examine, such as ‘it’s better to show miners digging than to show miners standing idle”, or “a round ‘CLICK HERE’ button works better than a square one”. When we have such a hypothesis, we create two (or more) versions of each ad and run them for different cohorts. In this case, the cohorts may be a simple as:
- Installed our game on Day X after seeing an ad with a round button.
- Installed our game on Day X after seeing an ad with a square button.
After a week, we can look at the data and see that, for example, we gained more installs from ads with round buttons. If so, we might want to make all of our ads with round buttons from here on.
Whatever the result, we’ll take that learning and use it to make our next set of UA creatives that much more effective. And remember that effectiveness might not end with an install. We’ll keep tracking these install cohorts through D1, D7, and so on, to see if their longer-term value holds – or to see if they’re part of the 45% who deletes games within 30 days.
We could spend a lot of money making an amazing, 3D, AAA blockbuster ad that would lead to millions of downloads, but if it set players up to expect one kind of game and we delivered another, we’d just be disappointing them. Disappointed players leave the game, uninstall and their lifetime value is actually a negative, both on our brand and our bottom line.
We work hard to build the best ads that match their platforms, excite viewers, and draw in the players who are excited to play our game. That might mean we run fast-paced, flashy ads on TikTok & Snapchat where users are likely to have the sound turned-on and are expecting short-form entertainment. Whereas if we’re showing our ad within another game, we can focus more on gameplay, and give viewers a longer demo of our core loop.
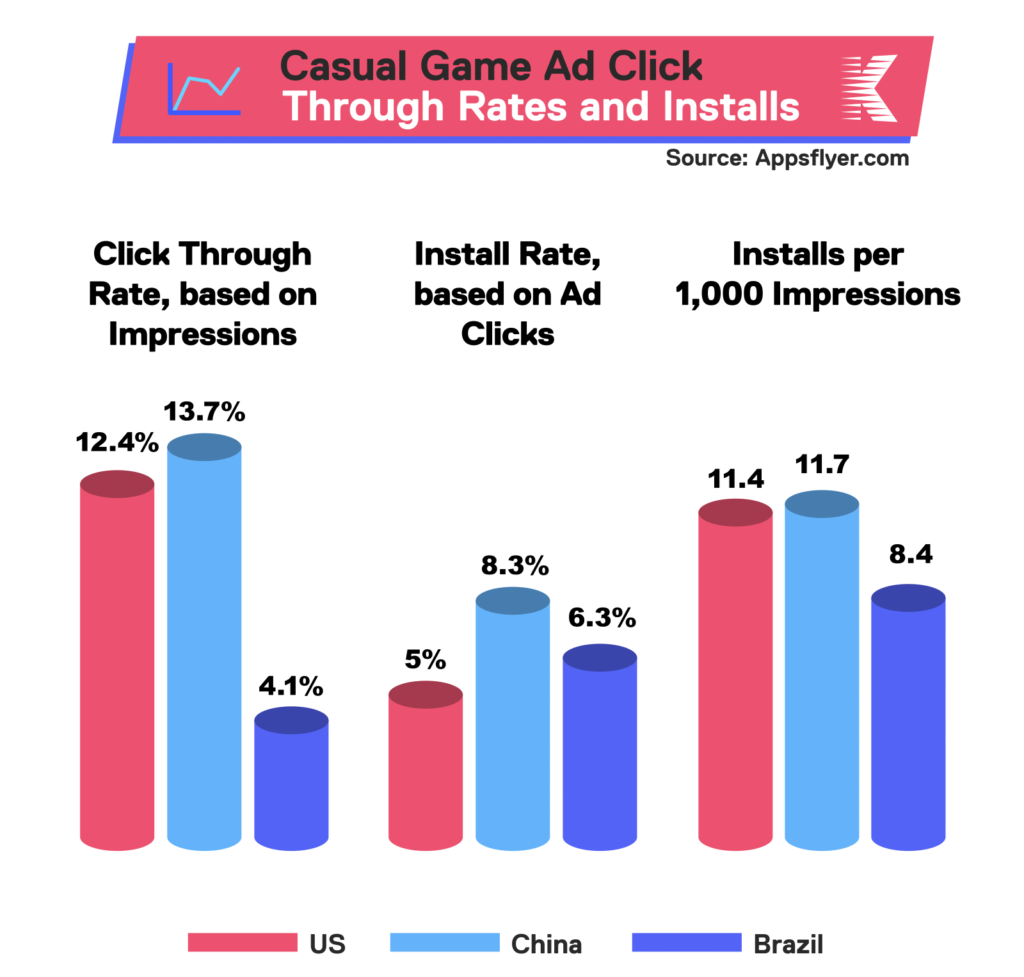
How effective are ads in general?
As you can see, it varies by country and – as you can surely imagine – by other cohorts like Ad platform, device and game genre. But if on average, fewer than 15% of people who see our ad will actually click on it – and around 1% will then install our game – we have to show a lot of ads. We also have the opportunity to make them better and more engaging. Going from 11 installs per 1,000 impressions to 14 or 15 would be a huge difference.
UA is a complicated business and our team is working to optimize both our ads and our ad placements every day. Even for a game as successful as ours, there’s no rest in the hyper-competitive gaming market.
Now that we’ve seen how we get players into the game, our next two posts will look at the player’s journey through the game – from first mineshaft all the way to endgame. Stay tuned!
Looking for a job in UA? Check out our open positions below or over on our career page!

