
As we move into our fourth year of IMT growth, we’re making data a larger and larger part of our decision-making. We grew the game with player-feedback and instinct, and while we’re not leaving either behind, we’re now putting greater emphasis on data. On that note, we thought it would be interesting to dive into some of the numbers behind our weekly event mines and share how players are playing them.
Over the last three months (as of writing this article) we’ve released twelve event mines, one per week. Each week, roughly half of our player base plays them.
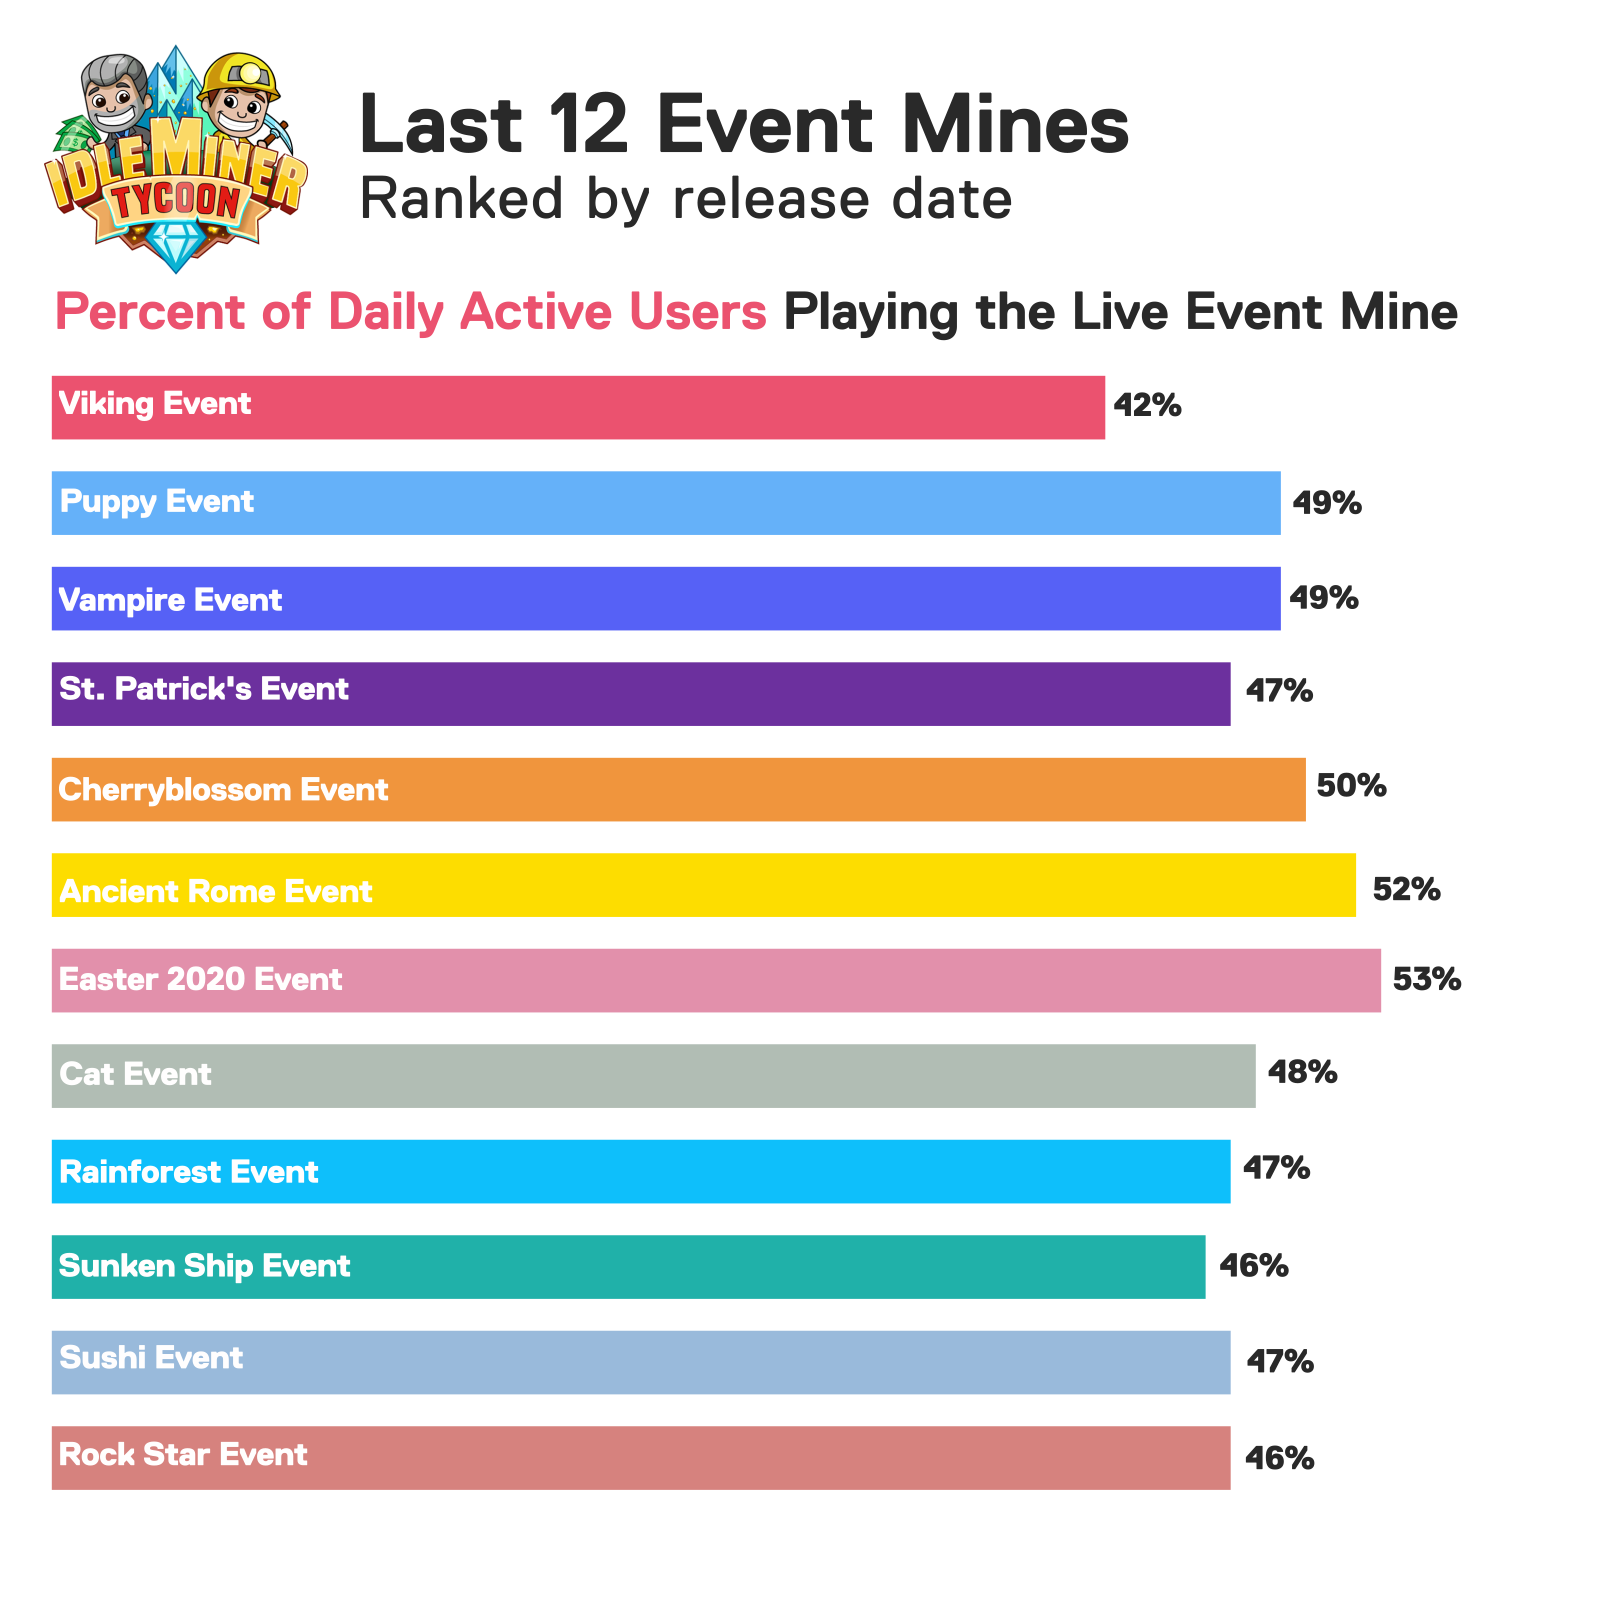
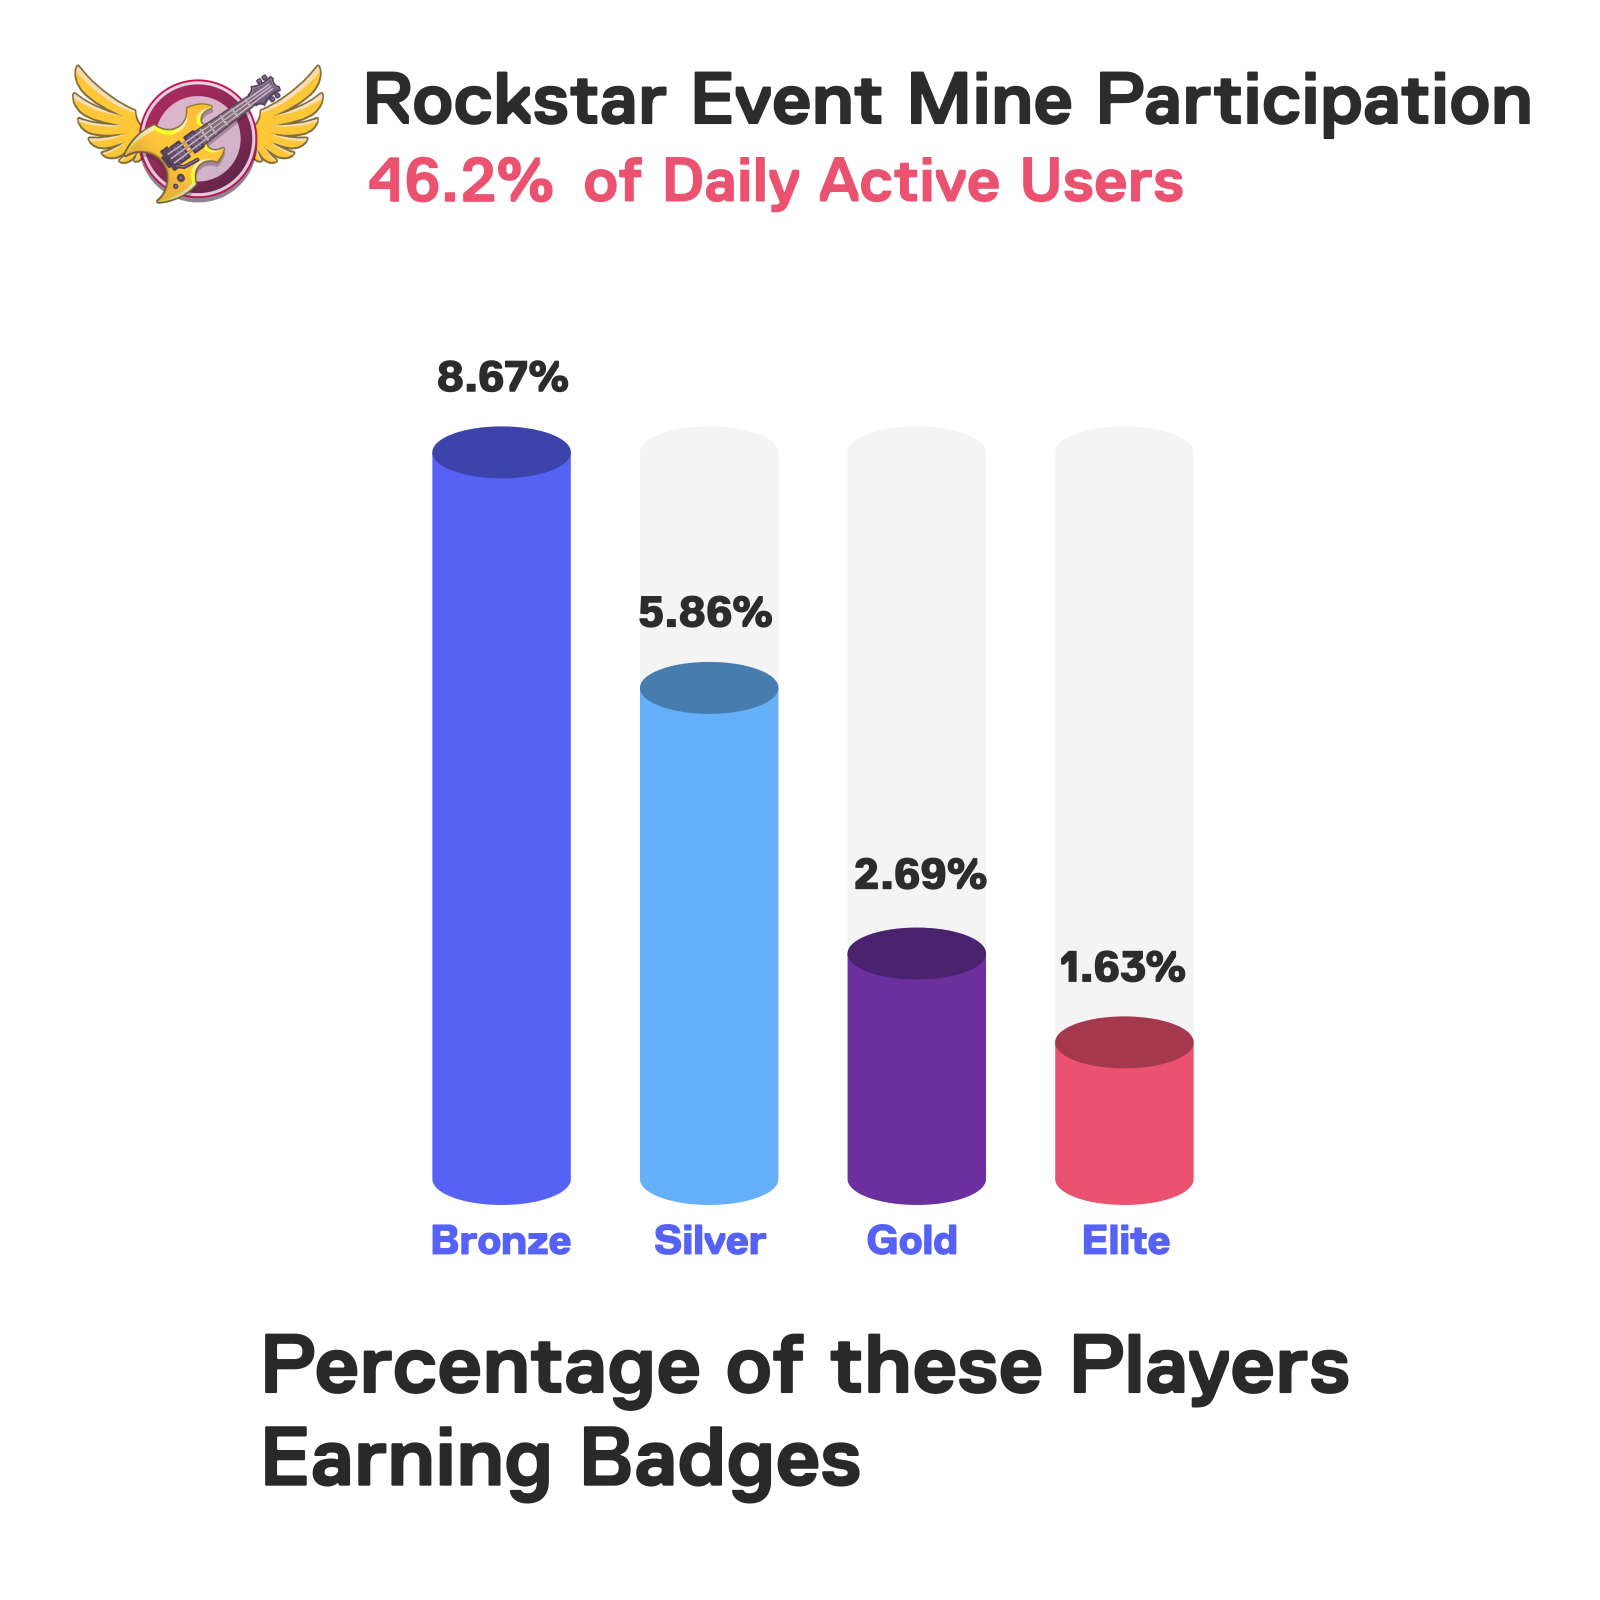
Looking a little more closely at one of our recent mines, the Rockstar Mine, 46% of all our players played it. But did they play every day?
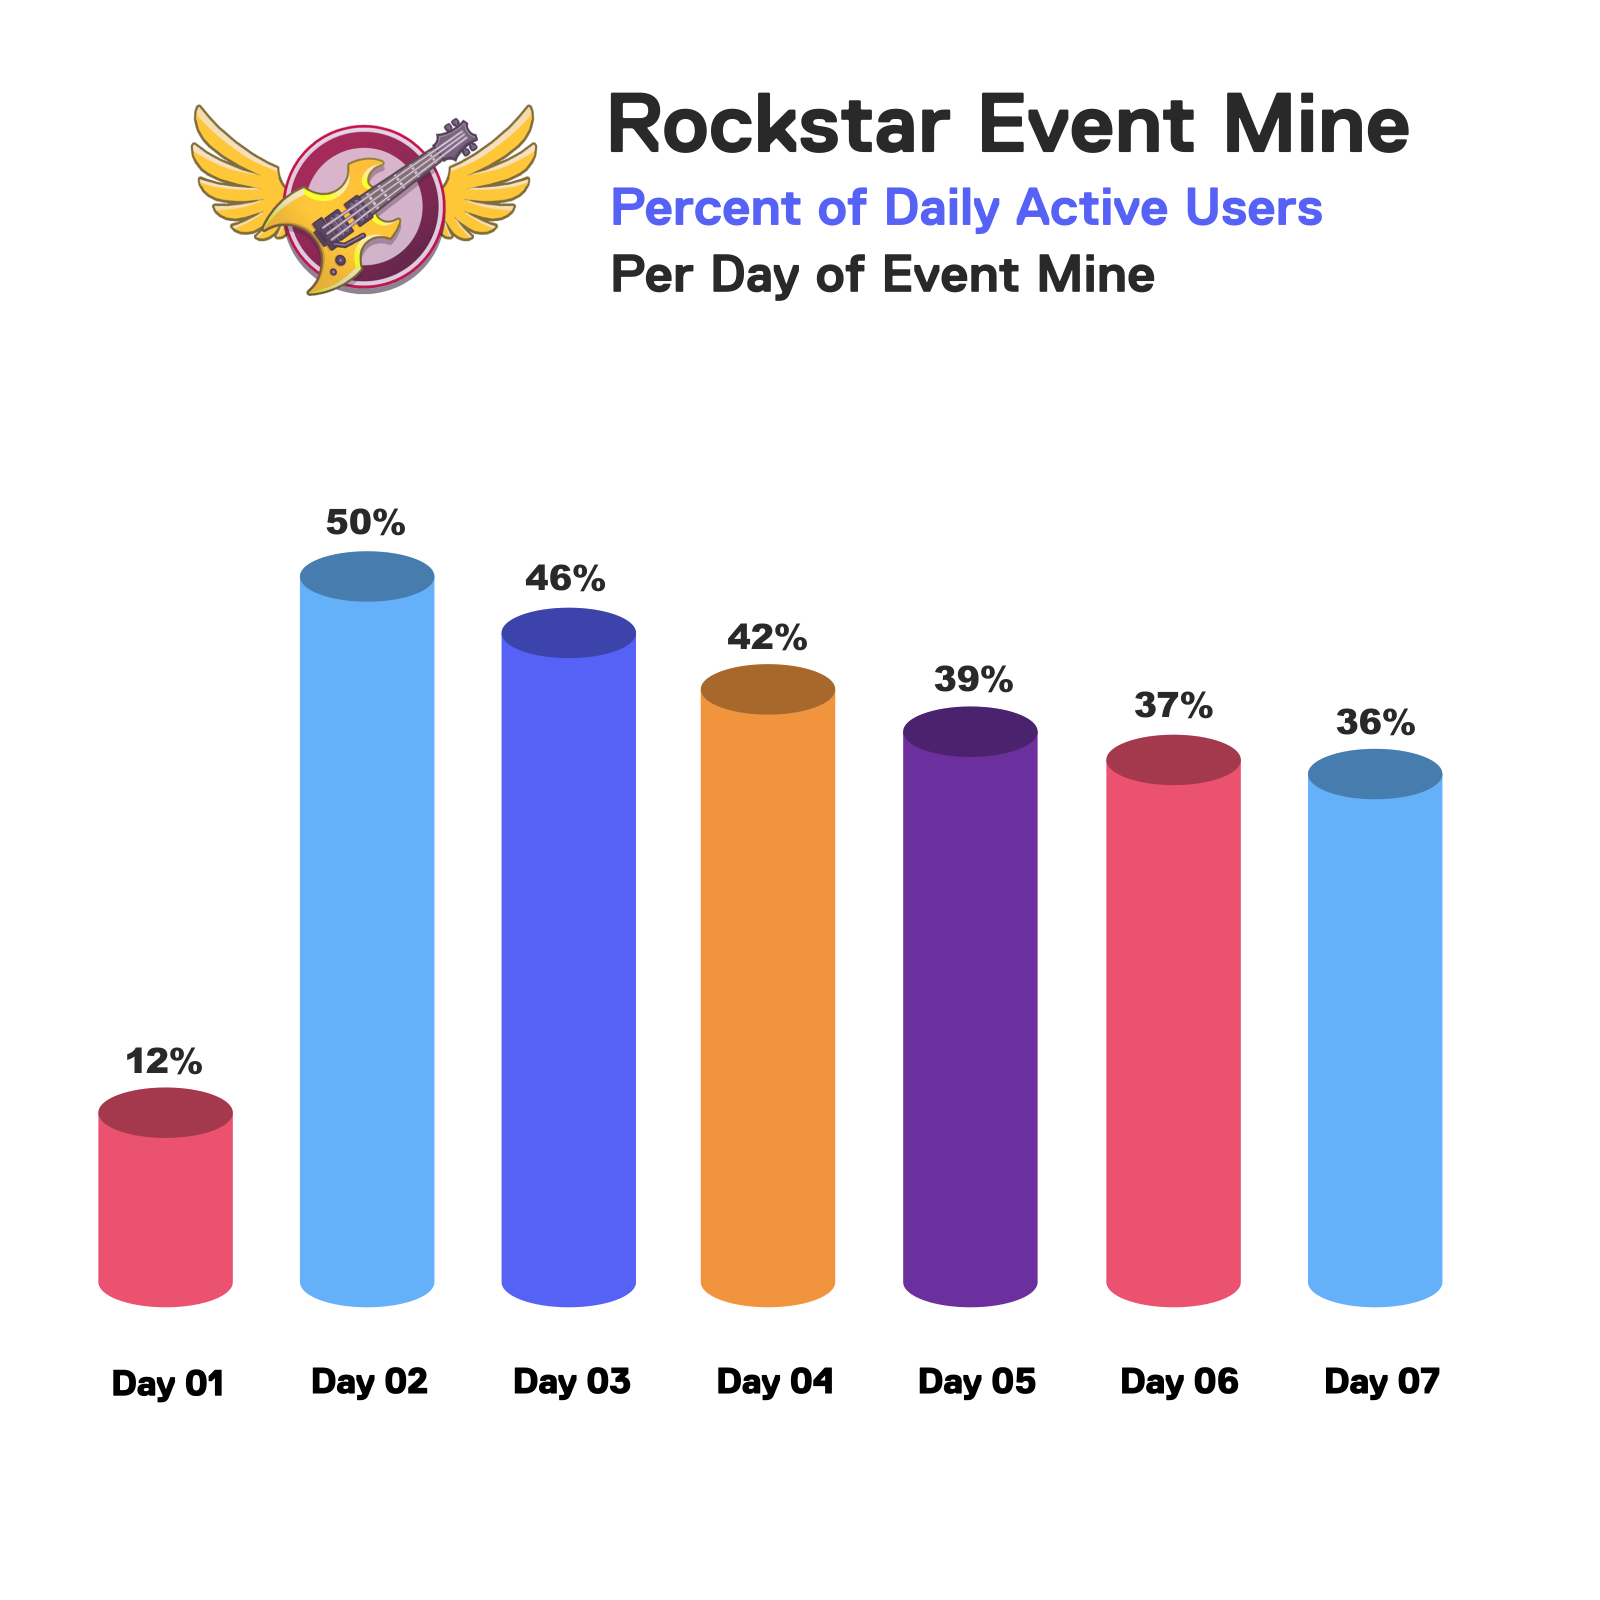
Across all users, participation spikes early in the event. 50% of our players were active on Day 02. Then participation slowly tails off, leading to around one-third of our users still playing by day seven.
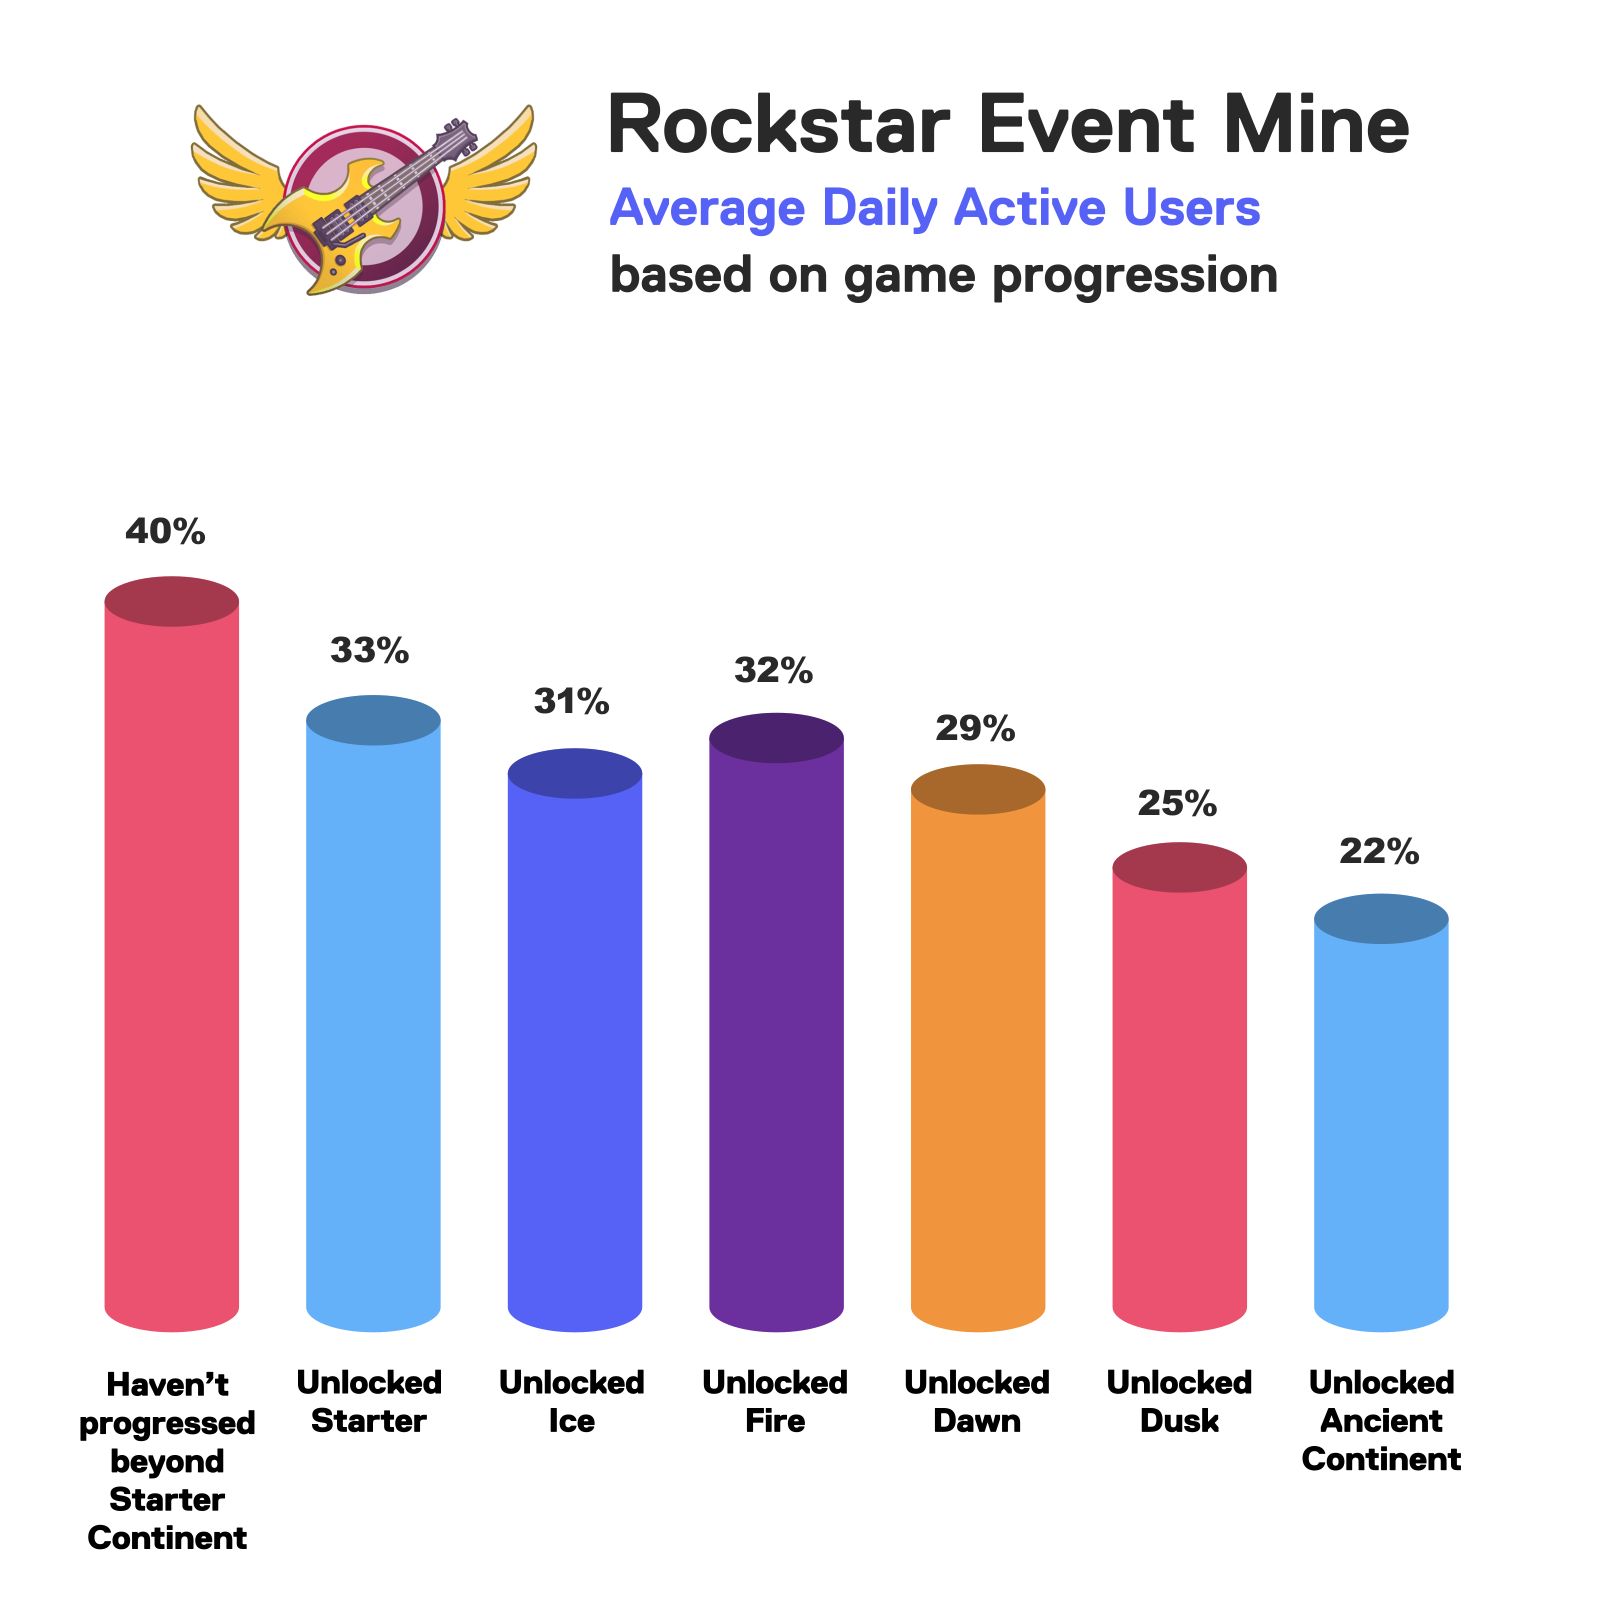
Now what if we sorted our Daily Active Users based on how far in the game they’ve progressed?
To provide some context, our game features seven continents and each continent has five mines. Players unlock each mine progressively in a set order, making mine and continent progression a simple way to judge how long someone’s been playing.
Our newest players haven’t yet completed the starter continent and are playing between one and four mines. Our most seasoned players have unlocked all 35 mines on all seven continents.
Looking at Daily Active Engagement, averaged across all seven days, it’s pretty clear that our veteran players have figured something out.
Let’s compare our newest players and our endgame players.
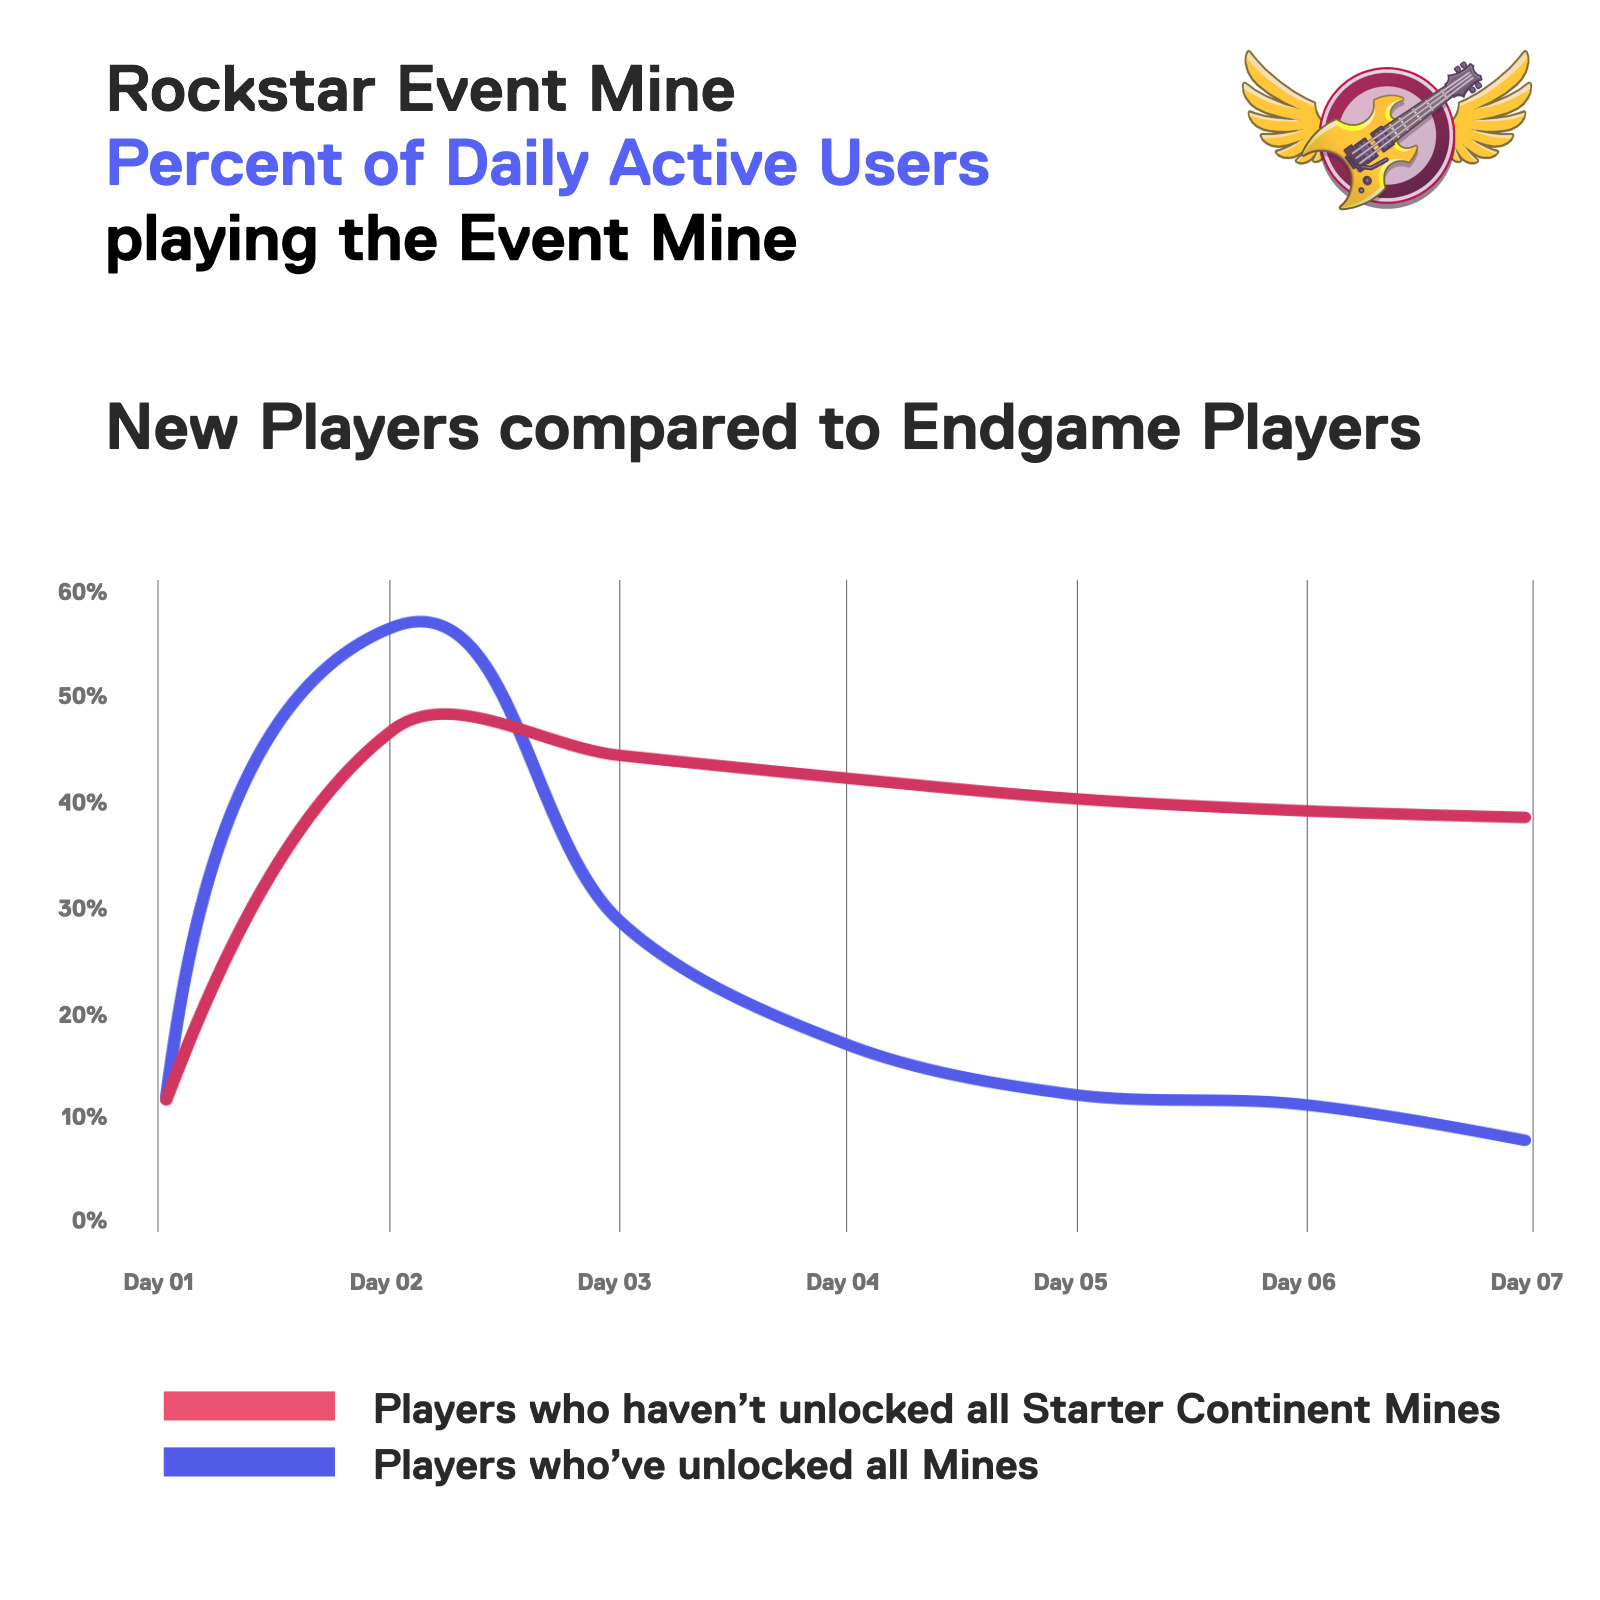
Day 01 engagement is fairly consistent for both groups, but Day 02 engagement spikes much more dramatically for endgame players. Nearly 60% of endgame versus nearly 50% of new players were in the Rockstar Mine on Day 02. Beyond Day 02, the two groups dramatically diverge. Why?
Efficiency.
Our endgamers are good players and with crafty uses of Boosts and Super Cash they’re winning badges quickly. Take a close look at the average badge completion by day chart.
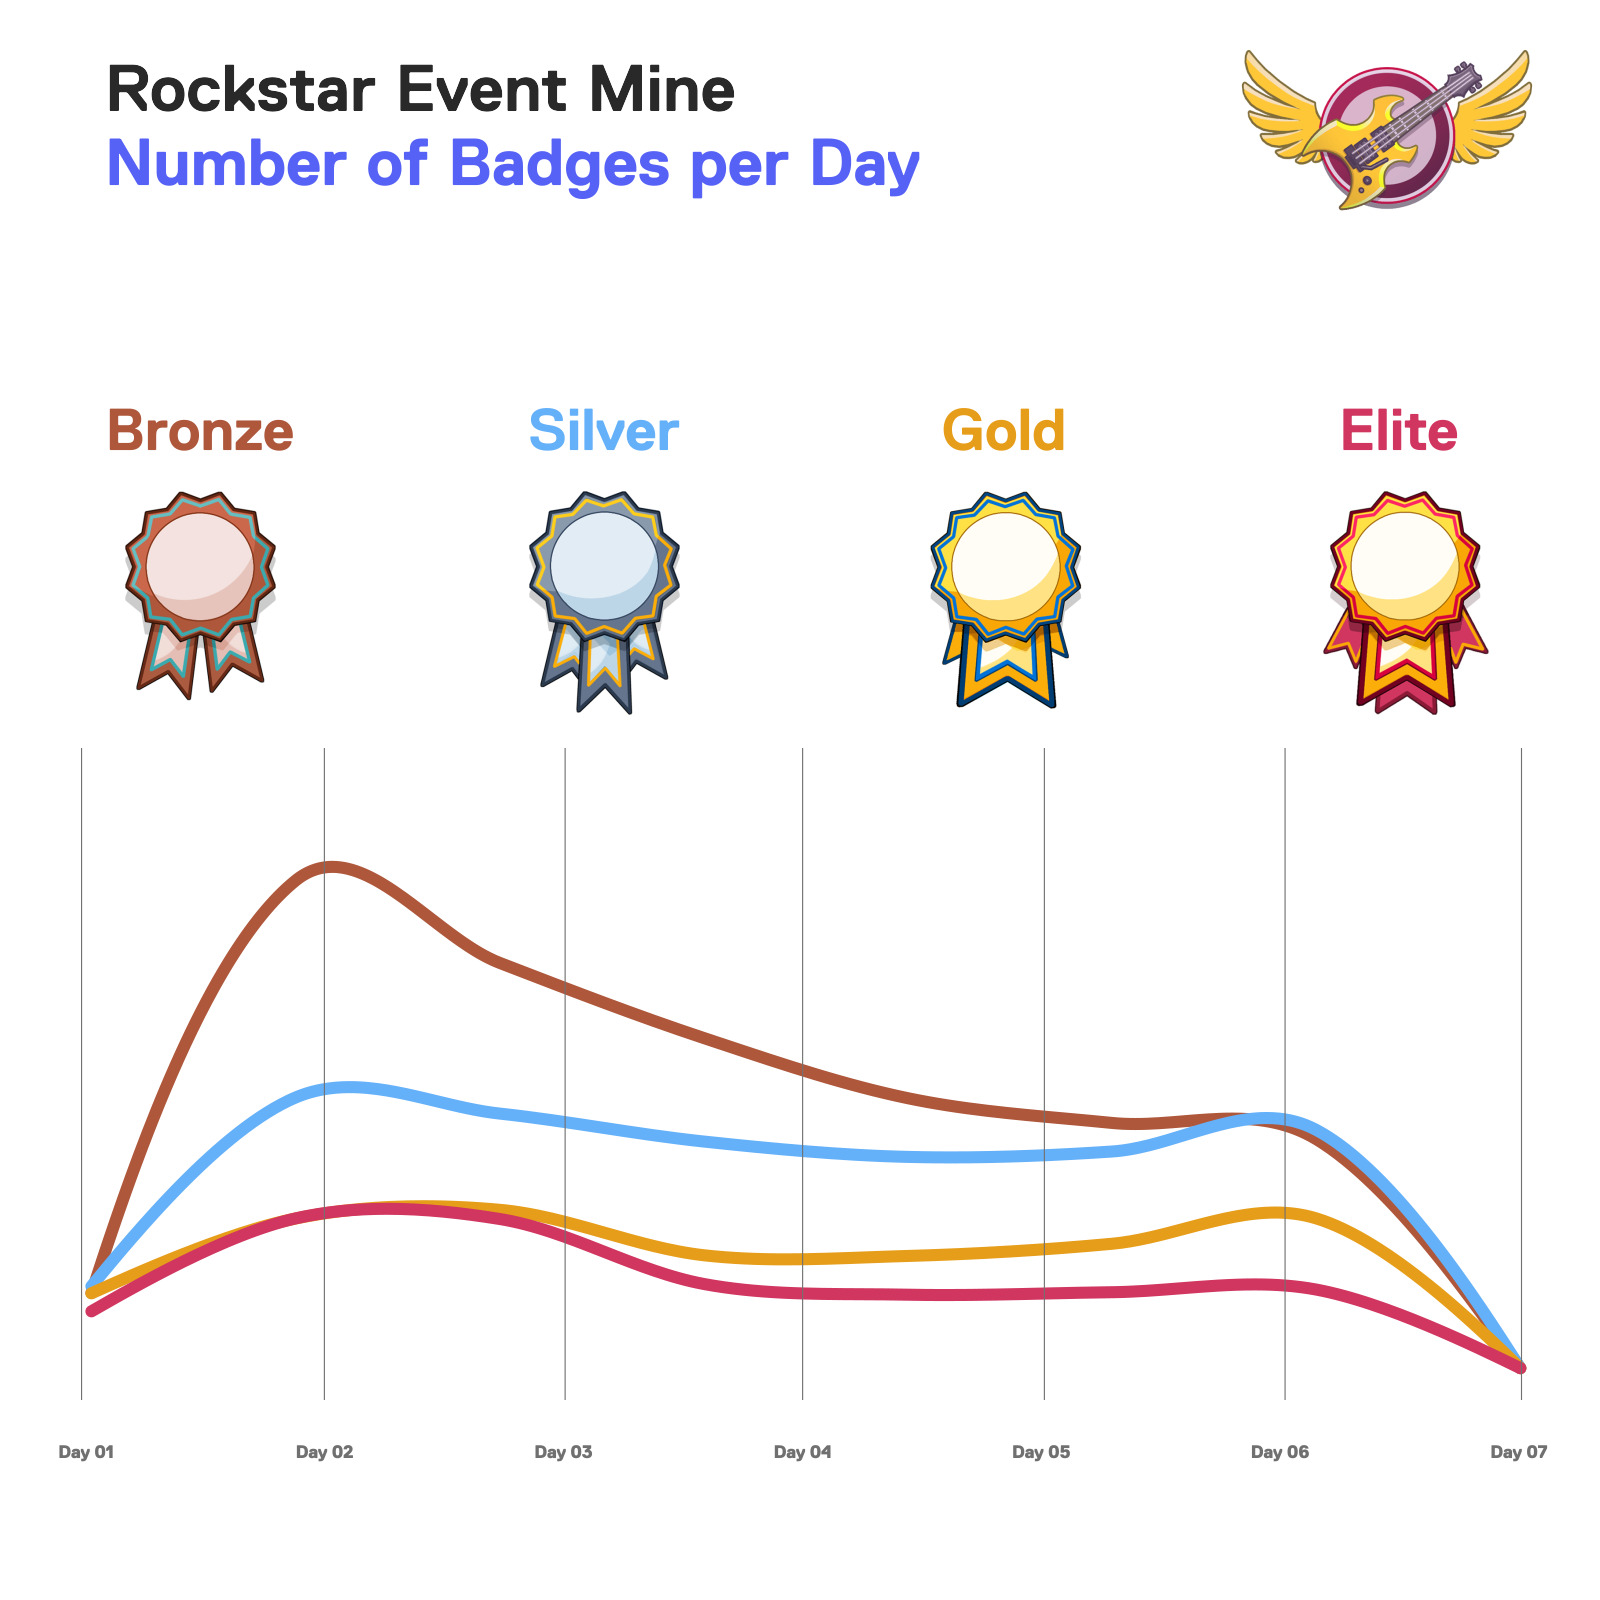
It’s no surprise that the trend line of badges looks a lot like the playtime of our endgame players. They know the game well and are winning Bronze badges on the second day. As the sixth day rolls around, there are small spikes in both participation and badge achievement as the less hasty players still manage to hit their milestones.
It’s not surprising that our end-game players drive the badge curve as strongly as they do. Remember the statistic that started this post? 46% of all players participated in the Rockstar event.
Of that 46%, 8% won a Bronze badge, for unlocking 15 mineshafts. 5% won Silver, for building their 16th mineshaft up to Level 500. 2% won Gold, for building all mineshafts, elevator and warehouse up to max level. And 1% won Elite, for finishing the mine in under 36 hours.
Most players don’t earn badges, so our endgamers show up disproportionately in the badge counts.
What else does the data have to say? Keep your eyes on this space! We’ll be checking back in with another data dive before too long.